Nurse Practitioner Salary in Montana: $139,808 (2026)
Quick Answer:Across Montana's 7 metropolitan areas, the average median nurse practitioner pay sits at $139,808/year heading into 2026 — a figure projected from 2025 BLS OEWS wage data for SOC 29-1171. Because Montana sits at BEA RPP 96.2 (4% below the U.S. baseline), that statewide median translates to roughly $145,331 in nationally-comparable purchasing power. Highest-paying metros: Bozeman ($139,990), Billings ($139,050), Helena ($136,420).
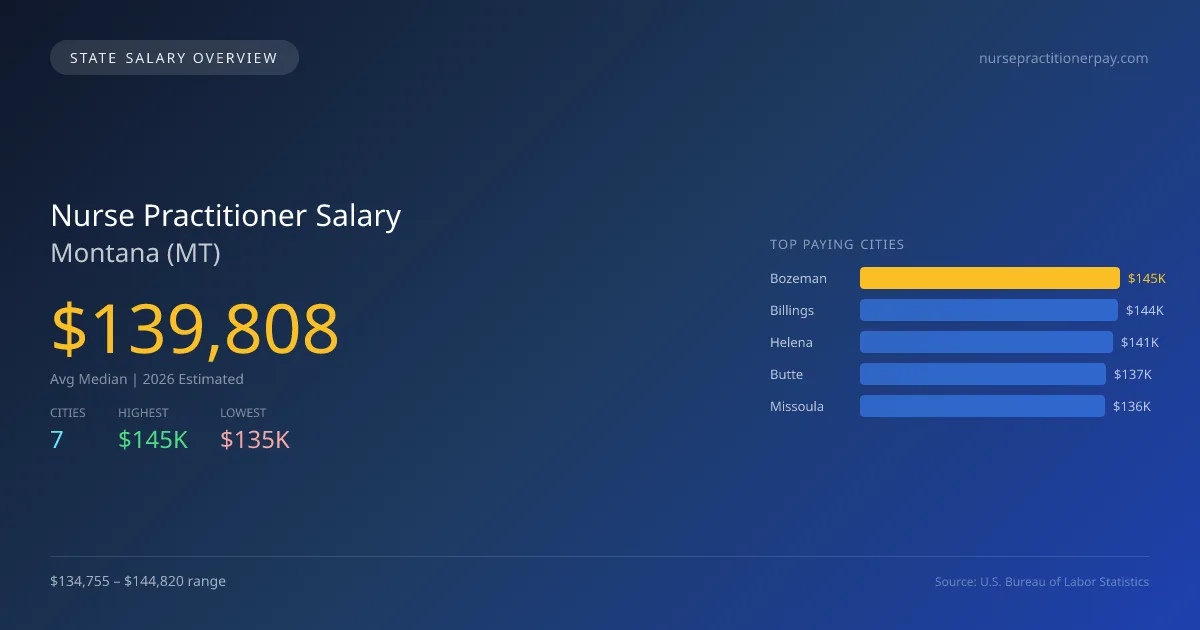
In 2026, nurse practitioners in Montana are projected to earn an average median salary of $139,809, which is slightly above the national median of $136,864, representing a 2.2% increase. The highest salaries are found in Bozeman at $144,820, while Kalispell offers the lowest at $134,755, creating a notable salary gap of $10,065. This difference is largely driven by local cost of living, demand for healthcare services, and the concentration of specialized medical facilities in urban areas like Bozeman. Montana's nurse practitioners operate under specific licensing requirements and scope of practice laws that permit them to diagnose and treat patients independently, which contributes to their essential role in the healthcare system. Current data indicates a solid job market with a projected annual growth rate of 3.45%, suggesting that the demand for nurse practitioners will continue to rise, fueled by an aging population and a focus on accessible healthcare in rural communities. With a total employment of 671 nurse practitioners across the state, cities such as Billings ($143,847), Helena ($141,126), and Butte ($137,150) also offer competitive salaries. This indicates a positive outlook for those entering the field in various metropolitan areas in Montana.
Montana Nurse Practitioner Salary Range
Overall salary range in Montana: $99,353 (lowest entry-level) to $179,444 (highest top earner)
Montana vs National Average
Montana nurse practitioners earn 2.15% more than the national median (+$2,944/year difference).
Montana Nurse Practitioner Salary Distribution (2026)
Nurse Practitioner salaries in Montana range from $109,853 (entry-level, 10th percentile) to $167,449 (top earners, 90th percentile), with a median of $139,808. The Montana median is $2,944 above the US national median of $136,864. The average hourly rate is $67.22/hr. Approximately 671 nurse practitioners are employed across 7 cities.
2019 BLS Actual
$109,085
2025 BLS Actual
$135,146
2026 Current Est.
$139,808
2019–2027 Growth
+32.6%
Salary Trajectory for Nurse Practitioners in Montana (2019–2027)
2019–2025: actual BLS OEWS data for this metro area. 2026+: CAGR 3.45% projection.
| Year | Annual Salary | Status |
|---|---|---|
| 2019 | $109,085 | Actual |
| 2020 | $114,531 | Actual |
| 2021 | $115,600 | Actual |
| 2022 | $120,596 | Actual |
| 2023 | $125,930 | Actual |
| 2024 | $130,286 | Actual |
| 2025 | $135,146 | Actual |
| 2026(current) | $139,808 | Estimated |
| 2027 | $144,632 | Projected |
Based on 7 years of BLS OEWS data for the Montana metropolitan area, the median nurse practitioner salary grew 23.9% from $109,085 (2019) to $135,146 (2025). At a 3.45% compound annual growth rate, salaries are projected to reach $144,632 by 2027 — a total increase of $35,547 (32.59%) from 2019.
Note: Historical values (2019–2025) are actual BLS OEWS figures for the Montana metropolitan area, sourced from annual Occupational Employment and Wage Statistics surveys. 2026–2026 figures are current estimates, and 2027 values are projections, calculated using a 3.45% CAGR derived from 7-year BLS historical data. Actual salaries may vary based on employer, experience, certifications, and local market conditions.
Top 5 Highest Paying Cities in Montana
Lowest Paying Cities in Montana
| City | Median Salary |
|---|---|
| Kalispell | $134,755 |
| Great Falls | $134,826 |
| Missoula | $136,192 |
| Butte | $137,150 |
| Helena | $141,126 |
Best Value Cities for Nurse Practitioners in Montana
When adjusted for local cost of living, these Montana cities offer the most purchasing power for nurse practitioners.
| City | Nominal Salary | CoL Index | Adjusted Salary |
|---|---|---|---|
| Billings | $143,847 | 93.526 | $153,804 |
| Helena | $141,126 | 95.675 | $147,506 |
| Butte | $137,150 | 96.2 | $142,568 |
| Bozeman | $144,820 | 102.51 | $141,274 |
| Missoula | $136,192 | 96.445 | $141,212 |
Adjusted salary = nominal salary × (100 / CoL index). CoL index: 100 = national average. Lower index = lower cost of living.
Salary by Experience Level in Montana
| Experience Level | Estimated Annual |
|---|---|
| Entry Level (0-2 years) | $109,853 |
| Mid Career (3-7 years) | $139,808 |
| Experienced (7+ years) | $167,449 |
Estimates based on BLS percentile data averaged across Montana metro areas. Individual pay varies by employer, certifications, and specialization.
All 7 Cities in Montana
More Montana Salary Data
Senior / Experienced
Top earner salaries for experienced nurse practitioners.
Explore More Nurse Practitioner Salary Data
Frequently Asked Questions
How much do nurse practitioners make in Montana in 2026?
What is the highest paying city for nurse practitioners in Montana?
How does Montana nurse practitioner pay compare to the national average?
What is the entry-level nurse practitioner salary in Montana?
How many nurse practitioners are employed in Montana?
Which Montana city offers the best value for nurse practitioners?
Written by Maria Gonzalez, MSN, NP-C
Career Analyst
Maria has 10 years of experience in adult healthcare. She works in a community health clinic. Her specialty is chronic disease management.
Methodology & Data Source
Statewide salary figures on this page are 2026 projections based on the Bureau of Labor Statistics Occupational Employment and Wage Statistics (OEWS) survey, May 2026 release. A 3.45% compound annual growth rate (CAGR), derived from 6-year national BLS wage trends, was applied to each metro area's reported salary to estimate current 2026 nurse practitioner compensation across Montana. State averages are employment-weighted across 7 metro areas — larger metro areas with more nurse practitionerscontribute proportionally more to the average, producing figures that better reflect typical compensation. Individual pay varies by city, employer, certifications, and experience.
Data Sources & Methodology
Source: BLS, OEWS, 7-year dataset (–). Per-city data from annual BLS metropolitan area surveys.
2026 figures are projected from 2025 BLS data using a compound annual growth rate (CAGR) of 3.45%, derived from historical BLS wage trends for nurse practitioners (SOC 29-1171).
Compiled and verified by Maria Gonzalez, MSN, NP-C, a licensed nurse practitioner with 10+ years of clinical experience. · View source data at BLS.gov