Nurse Practitioner Salary in Oregon: $161,385 (2026)
Quick Answer:Across Oregon's 36 metropolitan areas, the average median nurse practitioner pay sits at $161,385/year heading into 2026 — a figure projected from 2025 BLS OEWS wage data for SOC 29-1171. Because Oregon sits at BEA RPP 102.6 (3% above the U.S. baseline), that statewide median translates to roughly $157,295 in nationally-comparable purchasing power. Highest-paying metros: Salem ($162,600), Hillsboro ($162,506), Bend ($159,100).
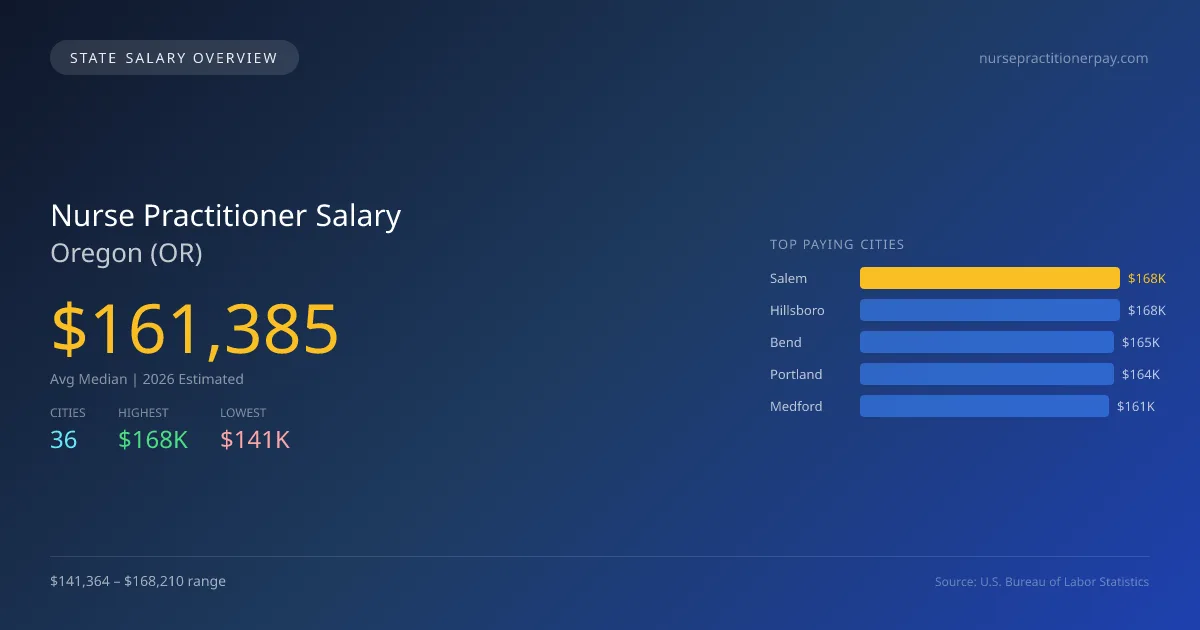
In Oregon, the projected average median salary for nurse practitioners in 2026 is $161,385, significantly higher than the national median of $136,864, showcasing a 17.9% salary premium. The highest-paying city in the state is Salem at $168,210, while Corvallis offers the lowest salary at $141,364, resulting in a salary gap of $26,846 between these two locations. Factors that contribute to this difference include the cost of living, demand for healthcare services, and the presence of healthcare facilities in each city. Oregon's nurse practitioners benefit from favorable state licensing requirements and a broad scope of practice, which allows them to operate independently in many settings. These conditions, combined with a growing demand for primary care providers, support a projected annual growth rate of 3.45% in the number of employed nurse practitioners. The job market outlook for nurse practitioners in Oregon appears strong, with top metros like Salem, Hillsboro, and Bend showing competitive salaries of $168,112 and $164,589, respectively. Overall, Oregon's landscape for nurse practitioners presents promising opportunities with competitive earnings and a favorable working environment.
Oregon Nurse Practitioner Salary Range
Overall salary range in Oregon: $114,135 (lowest entry-level) to $220,868 (highest top earner)
Oregon vs National Average
Oregon nurse practitioners earn 17.92% more than the national median (+$24,521/year difference).
Oregon Nurse Practitioner Salary Distribution (2026)
Nurse Practitioner salaries in Oregon range from $130,656 (entry-level, 10th percentile) to $200,851 (top earners, 90th percentile), with a median of $161,385. The Oregon median is $24,521 above the US national median of $136,864. The average hourly rate is $77.59/hr. Approximately 2,744 nurse practitioners are employed across 36 cities.
2019 BLS Actual
$116,023
2025 BLS Actual
$156,003
2026 Current Est.
$161,385
2019–2027 Growth
+43.9%
Salary Trajectory for Nurse Practitioners in Oregon (2019–2027)
2019–2025: actual BLS OEWS data for this metro area. 2026+: CAGR 3.45% projection.
| Year | Annual Salary | Status |
|---|---|---|
| 2019 | $116,023 | Actual |
| 2020 | $120,120 | Actual |
| 2021 | $128,503 | Actual |
| 2022 | $134,191 | Actual |
| 2023 | $139,363 | Actual |
| 2024 | $148,926 | Actual |
| 2025 | $156,003 | Actual |
| 2026(current) | $161,385 | Estimated |
| 2027 | $166,953 | Projected |
Based on 7 years of BLS OEWS data for the Oregon metropolitan area, the median nurse practitioner salary grew 34.5% from $116,023 (2019) to $156,003 (2025). At a 3.45% compound annual growth rate, salaries are projected to reach $166,953 by 2027 — a total increase of $50,930 (43.90%) from 2019.
Note: Historical values (2019–2025) are actual BLS OEWS figures for the Oregon metropolitan area, sourced from annual Occupational Employment and Wage Statistics surveys. 2026–2026 figures are current estimates, and 2027 values are projections, calculated using a 3.45% CAGR derived from 7-year BLS historical data. Actual salaries may vary based on employer, experience, certifications, and local market conditions.
Top 5 Highest Paying Cities in Oregon
Lowest Paying Cities in Oregon
| City | Median Salary |
|---|---|
| Corvallis | $141,364 |
| Milwaukie | $144,392 |
| Klamath Falls | $144,735 |
| The Dalles | $145,609 |
| Newberg | $147,180 |
Best Value Cities for Nurse Practitioners in Oregon
When adjusted for local cost of living, these Oregon cities offer the most purchasing power for nurse practitioners.
| City | Nominal Salary | CoL Index | Adjusted Salary |
|---|---|---|---|
| Hillsboro | $168,112 | 102.6 | $163,852 |
| Salem | $168,210 | 103.649 | $162,288 |
| Bend | $164,589 | 103.607 | $158,859 |
| Medford | $160,948 | 101.433 | $158,674 |
| Grants Pass | $153,272 | 97.76 | $156,784 |
Adjusted salary = nominal salary × (100 / CoL index). CoL index: 100 = national average. Lower index = lower cost of living.
Salary by Experience Level in Oregon
| Experience Level | Estimated Annual |
|---|---|
| Entry Level (0-2 years) | $130,656 |
| Mid Career (3-7 years) | $161,385 |
| Experienced (7+ years) | $200,851 |
Estimates based on BLS percentile data averaged across Oregon metro areas. Individual pay varies by employer, certifications, and specialization.
All 36 Cities in Oregon
| # | City | Median Salary |
|---|---|---|
| 1 | Salem | $168,210 |
| 2 | Hillsboro | $168,112 |
| 3 | Bend | $164,589 |
| 4 | Portland | $164,372 |
| 5 | Medford | $160,948 |
| 6 | Gresham | $160,756 |
| 7 | Beaverton | $156,179 |
| 8 | McMinnville | $155,755 |
| 9 | Oregon City | $155,572 |
| 10 | Woodburn | $154,536 |
| 11 | Lake Oswego | $153,792 |
| 12 | Forest Grove | $153,389 |
| 13 | Grants Pass | $153,272 |
| 14 | Tigard | $152,745 |
| 15 | Redmond | $152,695 |
| 16 | West Linn | $152,256 |
| 17 | Tualatin | $150,940 |
| 18 | Pendleton | $150,926 |
| 19 | Wilsonville | $150,708 |
| 20 | Eugene | $150,571 |
| 21 | Happy Valley | $149,414 |
| 22 | Hermiston | $149,000 |
| 23 | Central Point | $148,930 |
| 24 | Ashland | $148,917 |
| 25 | Keizer | $148,879 |
| 26 | Sherwood | $148,871 |
| 27 | Springfield | $148,626 |
| 28 | Coos Bay | $148,622 |
| 29 | Albany | $148,461 |
| 30 | Roseburg | $148,078 |
| 31 | Canby | $147,996 |
| 32 | Newberg | $147,180 |
| 33 | The Dalles | $145,609 |
| 34 | Klamath Falls | $144,735 |
| 35 | Milwaukie | $144,392 |
| 36 | Corvallis | $141,364 |
More Oregon Salary Data
Senior / Experienced
Top earner salaries for experienced nurse practitioners.
Explore More Nurse Practitioner Salary Data
Frequently Asked Questions
How much do nurse practitioners make in Oregon in 2026?
What is the highest paying city for nurse practitioners in Oregon?
How does Oregon nurse practitioner pay compare to the national average?
What is the entry-level nurse practitioner salary in Oregon?
How many nurse practitioners are employed in Oregon?
Which Oregon city offers the best value for nurse practitioners?
Written by Maria Gonzalez, MSN, NP-C
Career Analyst
Maria has 10 years of experience in adult healthcare. She works in a community health clinic. Her specialty is chronic disease management.
Methodology & Data Source
Statewide salary figures on this page are 2026 projections based on the Bureau of Labor Statistics Occupational Employment and Wage Statistics (OEWS) survey, May 2026 release. A 3.45% compound annual growth rate (CAGR), derived from 6-year national BLS wage trends, was applied to each metro area's reported salary to estimate current 2026 nurse practitioner compensation across Oregon. State averages are employment-weighted across 36 metro areas — larger metro areas with more nurse practitionerscontribute proportionally more to the average, producing figures that better reflect typical compensation. Individual pay varies by city, employer, certifications, and experience.
Data Sources & Methodology
Source: BLS, OEWS, 7-year dataset (–). Per-city data from annual BLS metropolitan area surveys.
2026 figures are projected from 2025 BLS data using a compound annual growth rate (CAGR) of 3.45%, derived from historical BLS wage trends for nurse practitioners (SOC 29-1171).
Compiled and verified by Maria Gonzalez, MSN, NP-C, a licensed nurse practitioner with 10+ years of clinical experience. · View source data at BLS.gov